
In March 2020, the COVID-19 pandemic triggered a sudden and severe economic downturn. Between February and May 2020, the number of unemployed individuals rose by more than 14 million, resulting in an unprecedented increase in the unemployment rate, which went from 3.8% in February to 14.4% in April. Even though unemployment has declined in recent months, with some individuals returning to work, the rate is still much higher than it was one year ago (7.9% in September 2020 vs. 3.5% in September 2019). Further, as of September 2020, there are 19.4 million persons unable to work due to the pandemic, as well as 6.3 million persons working only part time even though they would prefer to work more.

In the face of the coronavirus (COVID-19) pandemic, food assistance programs adapted quickly and in unprecedented ways to meet the challenges of high unemployment, disruptions in the food supply, and school closures. Supported by US Department of Agriculture’s COVID-19 program-specific waivers, some programs relaxed their eligibility criteria, while others improvised on delivery modalities or temporarily increased benefits.1 To examine food assistance program participation and participant experiences during the first few months of the pandemic, we collected online survey data in July 2020 from a sample of over 1,500 U.S. households, representative of the US population. This brief summarizes participation in key food assistance programs, namely, the Supplemental Nutrition Assistance Program (SNAP), the Special Supplemental Program for Women Infants and Children (WIC), School Food Programs, as well as emergency food assistance provided through Food Pantries.

Many factors influence children’s health behaviors and health outcomes. The Social Ecological Model (SEM) groups these factors into interactive layers, creating a framework for understanding their influence and for designing interventions to achieve positive change. The layers of influence in the SEM include individual, interpersonal, organizational, community, and policy factors.

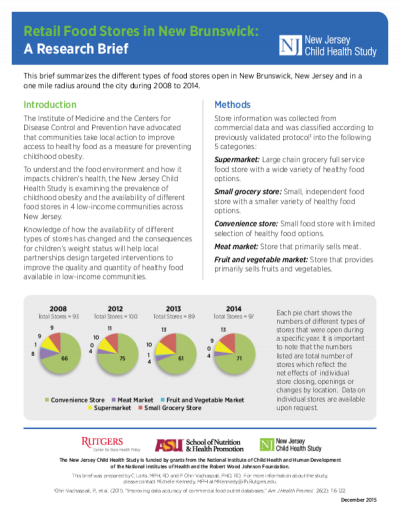
This brief summarizes the different types of food stores open in New Brunswick, New Jersey and in a one mile radius around the city during 2008 to 2014.
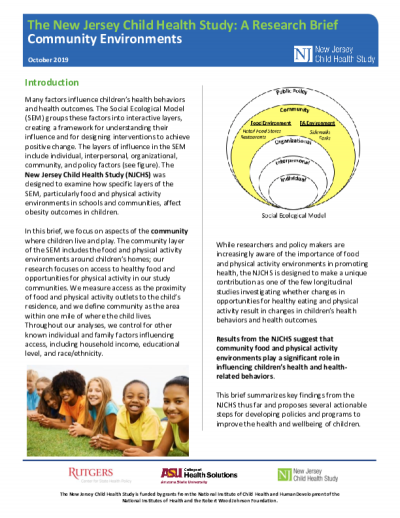
Many factors influence children’s health behaviors and health outcomes. The Social Ecological Model (SEM) groups these factors into interactive layers, creating a framework for understanding their influence and for designing interventions to achieve positive change. The layers of influence in the SEM include individual, interpersonal, organizational, community, and policy factors (see figure). The New Jersey Child Health Study (NJCHS) was designed to examine how specific layers of the SEM, particularly food and physical activity environments in schools and communities, affect obesity outcomes in children

With more than 19 million confirmed COVID-19 cases across the United States1 and over 500,000 in Arizona as of December 2020, the ongoing pandemic has had devastating impacts on local, national, and global economies. Prior to the pandemic (February 2020), based on U.S. Bureau of Labor Statistics data, the unemployment rate in Arizona was 6.5%, compared to 4.9% at the national level.3 Since the beginning of the COVID-19 pandemic (March 2020), the United States has experienced striking increases in the unemployment rate, reaching 13.2% in April. Similarly, in Arizona, the unemployment rate jumped to over 13.5% in April. The unemployment rates have since declined both nationally and in Arizona but remain higher compared to February 2020. In November 2020 (the most recent data available), the national unemployment rate was 6.7%, while in Arizona the rate was 7.8%—the 10th highest unemployment rate among all U.S. states.

This brief summarizes the different types of food stores open in Camden, New Jersey and in a one mile radius around the city during 2008 to 2014.

This brief summarizes the different types of food stores open in Newark, New Jersey and in a one mile radius around the city during 2008 to 2014.

This brief summarizes the different types of food stores open in Trenton, New Jersey and in a one mile radius around the city during 2008 to 2014.