
Objective: To evaluate five popular fast-food chains' menus in relation to dietary guidance.
Design: Menus posted on chains' websites were coded using the Food and Nutrient Database for Dietary Studies and MyPyramid Equivalents Database to enable Healthy Eating Index-2005 (HEI-2005) scores to be assigned. Dollar or value and kids' menus and sets of items promoted as healthy or nutritious were also assessed.
Setting: Five popular fast-food chains in the USA.
Subjects: Not applicable.
Results: Full menus scored lower than 50 out of 100 possible points on the HEI-2005. Scores for Total Fruit, Whole Grains and Sodium were particularly dismal. Compared with full menus, scores on dollar or value menus were 3 points higher on average, whereas kids' menus scored 10 points higher on average. Three chains marketed subsets of items as healthy or nutritious; these scored 17 points higher on average compared with the full menus. No menu or subset of menu items received a score higher than 72 out of 100 points.
Conclusions: The poor quality of fast-food menus is a concern in light of increasing away-from-home eating, aggressive marketing to children and minorities, and the tendency for fast-food restaurants to be located in low-income and minority areas. The addition of fruits, vegetables and legumes; replacement of refined with whole grains; and reformulation of offerings high in sodium, solid fats and added sugars are potential strategies to improve fast-food offerings. The HEI may be a useful metric for ongoing monitoring of fast-food menus.
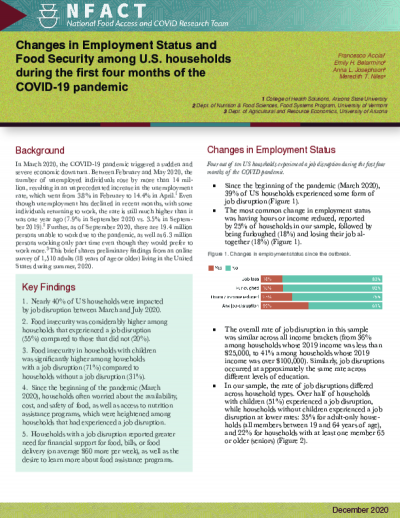
In March 2020, the COVID-19 pandemic triggered a sudden and severe economic downturn. Between February and May 2020, the number of unemployed individuals rose by more than 14 million, resulting in an unprecedented increase in the unemployment rate, which went from 3.8% in February to 14.4% in April. Even though unemployment has declined in recent months, with some individuals returning to work, the rate is still much higher than it was one year ago (7.9% in September 2020 vs. 3.5% in September 2019). Further, as of September 2020, there are 19.4 million persons unable to work due to the pandemic, as well as 6.3 million persons working only part time even though they would prefer to work more.
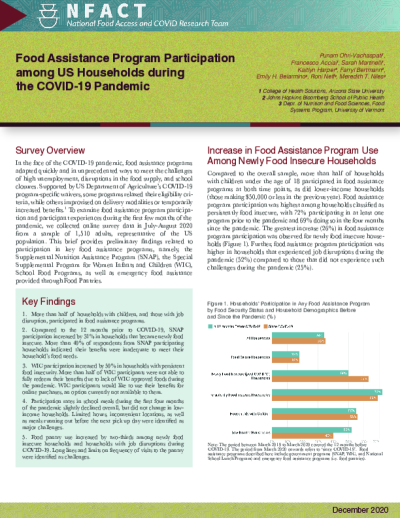
In the face of the coronavirus (COVID-19) pandemic, food assistance programs adapted quickly and in unprecedented ways to meet the challenges of high unemployment, disruptions in the food supply, and school closures. Supported by US Department of Agriculture’s COVID-19 program-specific waivers, some programs relaxed their eligibility criteria, while others improvised on delivery modalities or temporarily increased benefits.1 To examine food assistance program participation and participant experiences during the first few months of the pandemic, we collected online survey data in July 2020 from a sample of over 1,500 U.S. households, representative of the US population. This brief summarizes participation in key food assistance programs, namely, the Supplemental Nutrition Assistance Program (SNAP), the Special Supplemental Program for Women Infants and Children (WIC), School Food Programs, as well as emergency food assistance provided through Food Pantries.
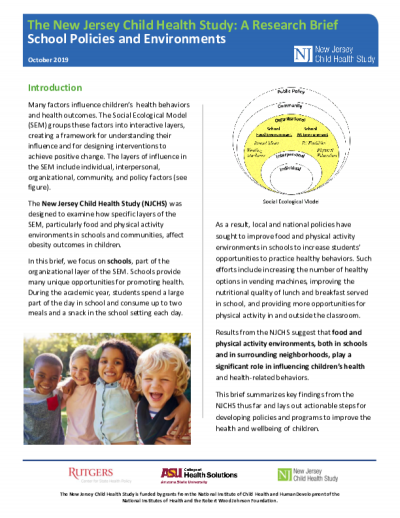
Many factors influence children’s health behaviors and health outcomes. The Social Ecological Model (SEM) groups these factors into interactive layers, creating a framework for understanding their influence and for designing interventions to achieve positive change. The layers of influence in the SEM include individual, interpersonal, organizational, community, and policy factors.

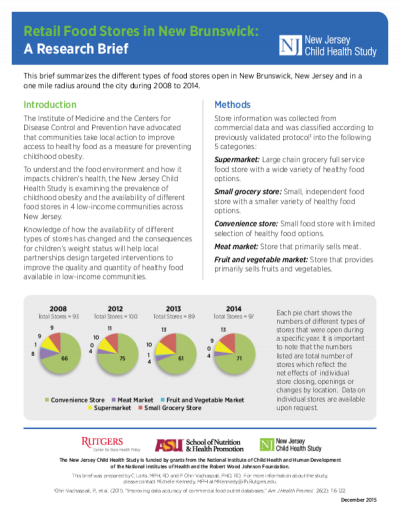
This brief summarizes the different types of food stores open in New Brunswick, New Jersey and in a one mile radius around the city during 2008 to 2014.
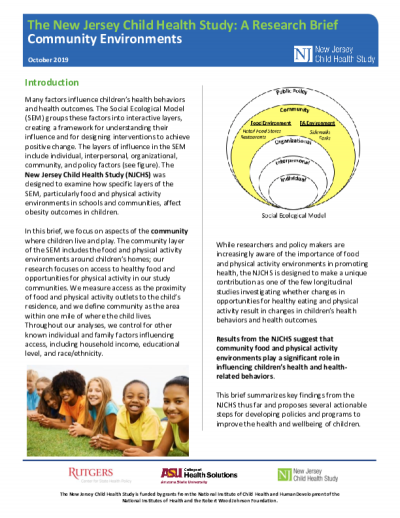
Many factors influence children’s health behaviors and health outcomes. The Social Ecological Model (SEM) groups these factors into interactive layers, creating a framework for understanding their influence and for designing interventions to achieve positive change. The layers of influence in the SEM include individual, interpersonal, organizational, community, and policy factors (see figure). The New Jersey Child Health Study (NJCHS) was designed to examine how specific layers of the SEM, particularly food and physical activity environments in schools and communities, affect obesity outcomes in children
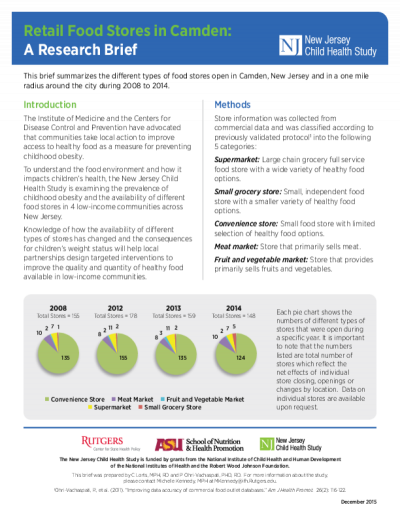
This brief summarizes the different types of food stores open in Camden, New Jersey and in a one mile radius around the city during 2008 to 2014.

This brief summarizes the different types of food stores open in Newark, New Jersey and in a one mile radius around the city during 2008 to 2014.
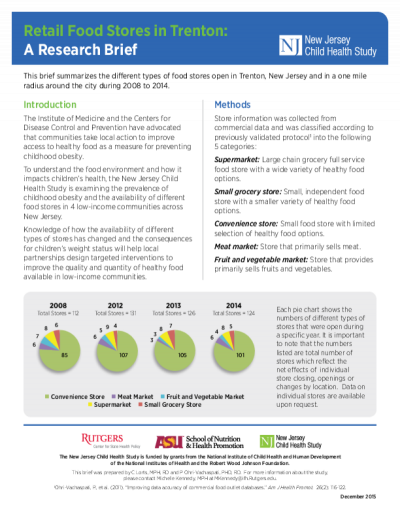
This brief summarizes the different types of food stores open in Trenton, New Jersey and in a one mile radius around the city during 2008 to 2014.