


Objective
In response to recent national efforts to increase the availability of healthy food in small stores, we sought to understand the extent to which small food stores could implement the newly published Healthy Small Store Minimum Stocking Recommendations and reflect on the new US Department of Agriculture Food and Nutrition Service's final rule for stocking of staple foods for Supplemental Nutrition Assistance Program–approved retailers.
Design
We collected qualitative and quantitative data from 57 small stores in four states (Arizona, Delaware, Minnesota, and North Carolina) that accepted Supplemental Nutrition Assistance Program but not Special Supplemental Nutrition Assistance Program for Women, Infants, and Children benefits. Data from semistructured, in-depth interviews with managers/owners were transcribed, coded, and analyzed. We collected quantitative store inventory data onsite and later performed descriptive analyses.
Results
Store interviews revealed a reluctant willingness to stock healthy food and meet new recommendations. No stores met recommended fruit and vegetable stocking, although 79% carried at least one qualifying fruit and 74% carried at least one qualifying vegetable. Few stores met requirements for other food categories (ie, whole grains and low-fat dairy) with the exception of lean proteins, where stores carrying nuts or nut butter were more likely to meet the protein recommendation. Water and 100% juice were widely available and 68% met basic healthy beverage criteria.
Conclusions
In contrast to the inventory observed, most owners believed store stock met basic recommendations. Further, findings indicate that small stores are capable of stocking healthy products; however, technical and infrastructure support, as well as incentives, would facilitate shifts from staple to healthier staple foods. Retailers may need support to understand healthier product criteria and to drive consumer demand for new products.

Background
The transition from the home to college is a phase in which emerging adults shift toward more unhealthy eating and physical activity patterns, higher body mass indices, thus increasing risk of overweight/obesity. Currently, little is understood about how changing friendship networks shape weight gain behaviors. This paper describes the recruitment, data collection, and data analytic protocols for the SPARC (Social impact of Physical Activity and nutRition in College) study, a longitudinal examination of the mechanisms by which friends and friendship networks influence nutrition and physical activity behaviors and weight gain in the transition to college life.
Methods
The SPARC study aims to follow 1450 university freshmen from a large university over an academic year, collecting data on multiple aspects of friends and friendship networks. Integrating multiple types of data related to student lives, ecological momentary assessments (EMAs) are administered via a cell phone application, devilSPARC. EMAs collected in four 1-week periods (a total of 4 EMA waves) are integrated with linked data from web-based surveys and anthropometric measurements conducted at four times points (for a total of eight data collection periods including EMAs, separated by ~1 month). University databases will provide student card data, allowing integration of both time-dated data on food purchasing, use of physical activity venues, and geographical information system (GIS) locations of these activities relative to other students in their social networks.
Discussion
Findings are intended to guide the development of more effective interventions to enhance behaviors among college students that protect against weight gain during college.

In response to lack of access to healthy foods, many low-income communities are instituting local healthy corner store programs. Some stores also participate in the United States Department of Agriculture's Special Supplemental Nutrition Program for Women, Infants, and Children (WIC) and the Supplemental Nutrition Assistance Program (SNAP). This study used two assessment tools to compare the healthfulness of offerings at stores participating in local healthy store programs (upgraded stores), WIC, and/or SNAP to that of similar non-participating stores.
Based on store audits conducted in 315 New Jersey corner stores in 2014, we calculated healthy food availability scores using subsections of the Nutrition Environment Measures Survey for Corner Stores (NEMS-CS-Availability) and a short-form corner store audit tool (SCAT). We used multivariable regression to examine associations between program participation and scores on both instruments.
Adjusting for store and block group characteristics, stores participating in a local healthy store program had significantly higher SCAT scores than did non-participating stores (upgraded: M = 3.18, 95% CI 2.65–3.71; non-upgraded: M = 2.52, 95% CI 2.32–2.73); scores on the NEMS-CS-Availability did not differ (upgraded: M = 12.8, 95% CI 11.6–14.1; non-upgraded: M = 12.5, 95% CI 12.0–13.0). WIC-participating stores had significantly higher scores compared to non-participating stores on both tools. Stores participating in SNAP only (and not in WIC) scored significantly lower on both instruments compared to non-SNAP stores.
WIC-participating and non-SNAP corner stores had higher healthfulness scores on both assessment tools. Upgraded stores had higher healthfulness scores compared to non-upgraded stores on the SCAT.

In March 2020, the COVID-19 pandemic triggered a sudden and severe economic downturn. Between February and May 2020, the number of unemployed individuals rose by more than 14 million, resulting in an unprecedented increase in the unemployment rate, which went from 3.8% in February to 14.4% in April. Even though unemployment has declined in recent months, with some individuals returning to work, the rate is still much higher than it was one year ago (7.9% in September 2020 vs. 3.5% in September 2019). Further, as of September 2020, there are 19.4 million persons unable to work due to the pandemic, as well as 6.3 million persons working only part time even though they would prefer to work more.
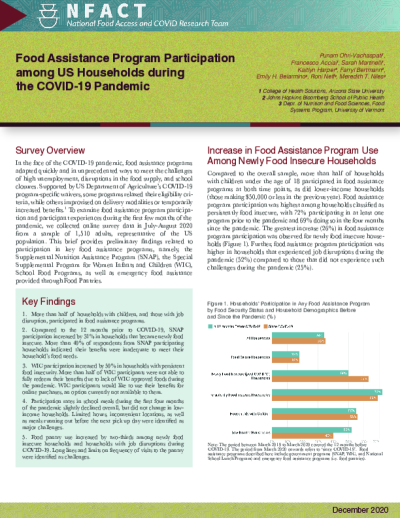
In the face of the coronavirus (COVID-19) pandemic, food assistance programs adapted quickly and in unprecedented ways to meet the challenges of high unemployment, disruptions in the food supply, and school closures. Supported by US Department of Agriculture’s COVID-19 program-specific waivers, some programs relaxed their eligibility criteria, while others improvised on delivery modalities or temporarily increased benefits.1 To examine food assistance program participation and participant experiences during the first few months of the pandemic, we collected online survey data in July 2020 from a sample of over 1,500 U.S. households, representative of the US population. This brief summarizes participation in key food assistance programs, namely, the Supplemental Nutrition Assistance Program (SNAP), the Special Supplemental Program for Women Infants and Children (WIC), School Food Programs, as well as emergency food assistance provided through Food Pantries.

Programs such as the Healthy Corner Store Initiative have been widely adopted in recent years to increase the availability of healthy foods in small retail food stores. Valid and reliable measures are necessary to evaluate the effectiveness of these programs. The validated instruments currently available for assessments require in-person evaluations, with surveys taking up to 30 minutes per store to complete. This instrument was developed by researchers at Arizona State University to simplify the process of evaluating the effectiveness of healthy store interventions, and to enable community partners and practitioners to conduct their own evaluations of food access. The SCAT was validated against an adapted version of the Nutrition Environment Measures Survey for Corner Stores, and tested for feasibility of use over the telephone. The SCAT was found to discriminate between corner stores in the top 20% of healthfulness scores from those in the lower 80% with 89% accuracy.
In 2015 a panel of experts was convened by Healthy Eating Research, a program of the Robert Wood Johnson Foundation, to establish a set of minimum guidelines small retail food stores could reach to be classified as meeting basic or preferred stocking levels. Work is currently in progress to assess how the SCAT scores correlate with basic and preferred levels.

Methods First-year students’ meal plan and residence information was provided by a large, public, southwestern university for the 2015-2016 academic year. A subset of students (n=619) self-reported their food security status. Logistic generalized estimating equations (GEEs) were used to determine if meal plan purchase and use were associated with food insecurity. Linear GEEs were used to examine several potential reasons for lower meal plan use. Logistic and Linear GEEs were used to determine similarities in meal plan purchase and use for a total of 599 roommate pairs (n=1186 students), and 557 floormates.
Results Students did not use all of the meals available to them; 7% of students did not use their meal plan for an entire month. After controlling for socioeconomic factors, compared to students on unlimited meal plans, students on the cheapest meal plan were more likely to report food insecurity (OR=2.2, 95% CI=1.2, 4.1). In Fall, 26% of students on unlimited meal plans reported food insecurity. Students on the 180 meals/semester meal plan who used fewer meals were more likely to report food insecurity (OR=0.9, 95% CI=0.8, 1.0); after gender stratification this was only evident for males. Students’ meal plan use was lower if the student worked a job (β=-1.3, 95% CI=-2.3, -0.3) and higher when their roommate used their meal plan frequently (β=0.09, 99% CI=0.04, 0.14). Roommates on the same meal plan (OR=1.56, 99% CI=1.28, 1.89) were more likely to use their meals together.
Discussion This study suggests that determining why students are not using their meal plan may be key to minimizing the prevalence of food insecurity on college campuses, and that strategic roommate assignments may result in students’ using their meal plan more frequently. Students’ meal plan information provides objective insights into students’ university transition.
